引き続きUser’s Guideを読んでいきます。
16ページからの内容となります。
前回の記事はこちら。
まずはplotの使い方から。
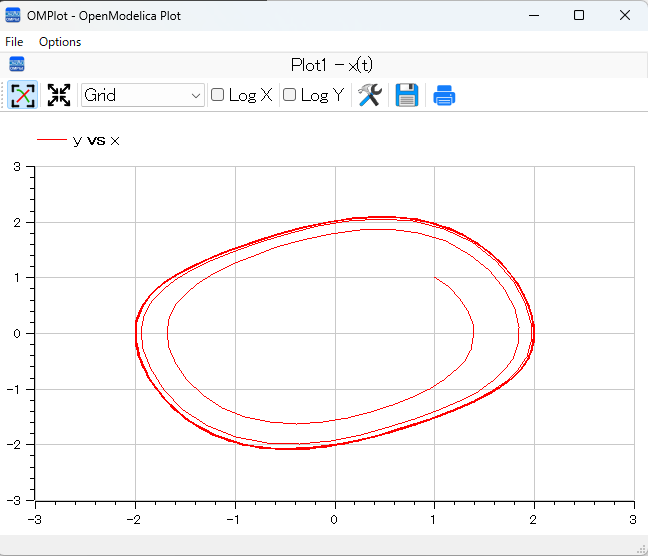
VanDerPol.moというモデルを実行してx,y平面にプロットします。
x,y平面にプロットするにはplotParametricを使います。
>> loadFile(getInstallationDirectoryPath() +"/share/doc/omc/testmodels/VanDerPol.mo")
true

>> simulate(VanDerPol, stopTime=80)
record SimulationResult
    resultFile = "C:/Users/HEngi/AppData/Local/Temp/OpenModelica/VanDerPol_res.mat",
    simulationOptions = "startTime = 0.0, stopTime = 80.0, numberOfIntervals = 500, tolerance = 1e-06, method = 'dassl', fileNamePrefix = 'VanDerPol', options = '', outputFormat = 'mat', variableFilter = '.*', cflags = '', simflags = ''",
    messages = "LOG_SUCCESS       | info    | The initialization finished successfully without homotopy method.
LOG_SUCCESS       | info    | The simulation finished successfully.
",
    timeFrontend = 0.0020116,
    timeBackend = 0.0024075,
    timeSimCode = 0.0012535,
    timeTemplates = 0.0101801,
    timeCompile = 1.8283933,
    timeSimulation = 4.4716652,
    timeTotal = 6.316174
end SimulationResult;

>> plotParametric(x,y)
true
このようなグラフとなります。

続いて、For文、While文、If文となります。
他の言語と似たような感じで書けそうです。
Forループは以下の通りです。
>> k:=0;

>> for i in 1:1000 loop
k:=k+1;
end for;

>> k
1000
Whileループは以下のようになります。
文字列のベクトルについても同様に使えます。
>> s:="";

>> i:=1;

>> while i<=10 loop
s:="abc "+s;
i:=i+1;
end while;

>> s
"abc abc abc abc abc abc abc abc abc abc "
If文は以下の通り。
a;bのように変数; 変数と記載することで複数の変数の値を確認できます。
>> if 5>2 then a := 77; end if; a
77

>> if false then
a := 5;
elseif a>50 then
b:= "test"; a:=100;
else
a:=34;
end if;

>> a;b
100
"test"
今回はここまでにします。
基本的な関数は一般的な文法で書けそうです。


コメント