引き続きUser’s Guideを読んでいきます。
13ページからの内容となります。
前回の記事はこちら。
今回はBouncingBallというモデルを使った例です。
この例は他のツール等でもたまに出てきますね。
サンプルモデルをいつもの場所から読み込みます。
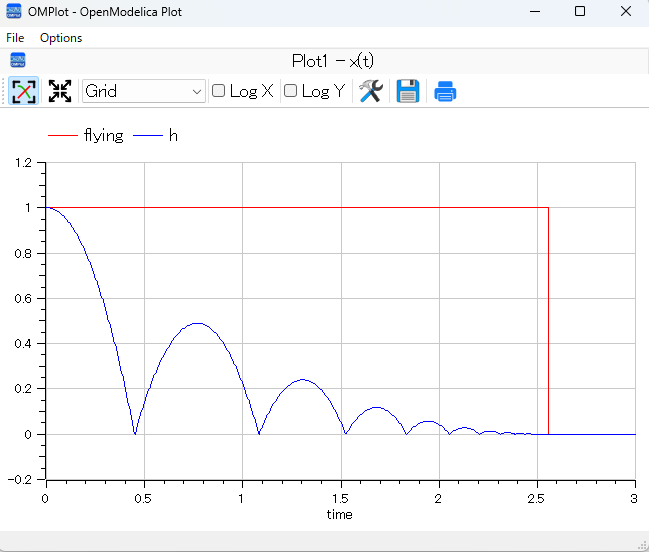
このモデルではボールを落とした時のhを高さ、vを速度として計算しています。
ボールが宙にあるときはflyingというフラグがtrue(1)となります。
>> loadFile(getInstallationDirectoryPath()+ "/share/doc/omc/testmodels/BouncingBall.mo")
true

>> list(BouncingBall)
"model BouncingBall
  parameter Real e = 0.7 \"coefficient of restitution\";
  parameter Real g = 9.81 \"gravity acceleration\";
  Real h(fixed = true, start = 1) \"height of ball\";
  Real v(fixed = true) \"velocity of ball\";
  Boolean flying(fixed = true, start = true) \"true, if ball is flying\";
  Boolean impact;
  Real v_new(fixed = true);
  Integer foo;
equation
  impact = h <= 0.0;
  foo = if impact then 1 else 2;
  der(v) = if flying then -g else 0;
  der(h) = v;
  when {h <= 0.0 and v <= 0.0, impact} then
    v_new = if edge(impact) then -e*pre(v) else 0;
    flying = v_new > 0;
    reinit(v, v_new);
  end when;
end BouncingBall;"
今回の例では.mosファイルにスクリプトを書き込み、実行します。
バッチ処理の際に重宝しそうです。
plotを複数の変数グラフ化するにはplot({h,flying})とすればよさそうです。
早速前回の不明点が解決しました。
なぜか例ではコメントアウトされています。
>> writeFile("sim_BouncingBall.mos","loadFile(getInstallationDirectoryPath() + \"/share/doc/omc/testmodels/BouncingBall.mo\");
simulate(BouncingBall, stopTime=3.0);
/* plot({h,flying}); */
")
true
>> runScript("sim_BouncingBall.mos")
"true
record SimulationResult
resultFile = \"C:/Users/HEngi/AppData/Local/Temp/OpenModelica/BouncingBall_res.mat\",
simulationOptions = \"startTime = 0.0, stopTime = 3.0, numberOfIntervals = 500, tolerance = 1e-06, method = 'dassl', fileNamePrefix = 'BouncingBall', options = '', outputFormat = 'mat', variableFilter = '.*', cflags = '', simflags = ''\",
messages = \"LOG_SUCCESS | info | The initialization finished successfully without homotopy method.
LOG_SUCCESS | info | The simulation finished successfully.
\",
timeFrontend = 0.0021968,
timeBackend = 0.0044978,
timeSimCode = 0.0014411,
timeTemplates = 0.0097033,
timeCompile = 1.8808076,
timeSimulation = 4.3914137,
timeTotal = 6.2903171
end SimulationResult;
"早速覚えたplot({h,flying})を実行してみます。
思った通り2つの系列をグラフ化できました。

val関数を使うと下記のように任意の時間での変数の値を補間して求められます。
>> val(h,1)
0.2250205207429666
clear()で読み込んでいるライブラリやモデルをクリアできます。
>> clear()
true

>> list()
""
今回はここまでとします。
val関数の使い方、plotの方法がわかりました。


コメント