引き続きUser’s Guide(Release v1.22.1)を読んでいきます。
83ページからの内容となります。
前回の記事はこちら。
チャプター4まで到達しました。
2D plotに関して書いてあります。前にもどこかで見たような。。。
まずは簡単な関数(HelloWorld)を作成します。
>> class HelloWorld
Real x(start = 1, fixed = true);
parameter Real a = 1;
equation
der(x) = - a * x;
end HelloWorld;
{HelloWorld}
初期条件x=1として傾きが-xとなる関数です。
作成したHelloWorldをTime=0~4sで実行します。
>> simulate(HelloWorld, outputFormat="csv", startTime=0, stopTime=4, numberOfIntervals=5)
record SimulationResult
    resultFile = "C:/Users/[ユーザー名]/AppData/Local/Temp/OpenModelica/HelloWorld_res.csv",
    simulationOptions = "startTime = 0.0, stopTime = 4.0, numberOfIntervals = 5, tolerance = 1e-06, method = 'dassl', fileNamePrefix = 'HelloWorld', options = '', outputFormat = 'csv', variableFilter = '.*', cflags = '', simflags = ''",
    messages = "LOG_SUCCESS       | info    | The initialization finished successfully without homotopy method.
LOG_SUCCESS       | info    | The simulation finished successfully.
",
    timeFrontend = 0.0020944,
    timeBackend = 0.0019305,
    timeSimCode = 0.0006472,
    timeTemplates = 0.0120828,
    timeCompile = 1.4154175,
    timeSimulation = 0.0669893,
    timeTotal = 1.4994668
end SimulationResult;
"[<interactive>:1:18-1:48:writable] Warning: Components are deprecated in class.
[<interactive>:1:51-1:70:writable] Warning: Components are deprecated in class.
[<interactive>:1:82-1:97:writable] Warning: Equation sections are deprecated in class.
"
outputFormat=”csv”としていますのでHelloWorld_res.csvに計算結果が保存されています。
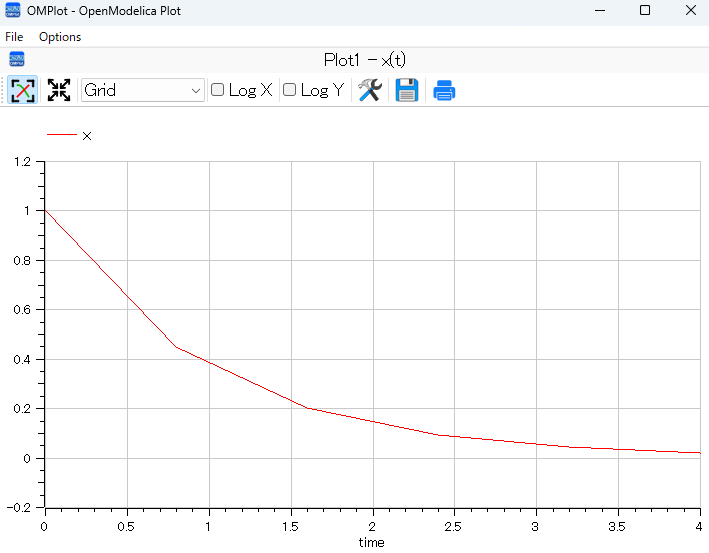
plot(x)でxの時系列データをグラフ化します。
>> plot(x)
true
上図はnumberOfIntervals=5のため、0.8sごとに結果が出力されています。
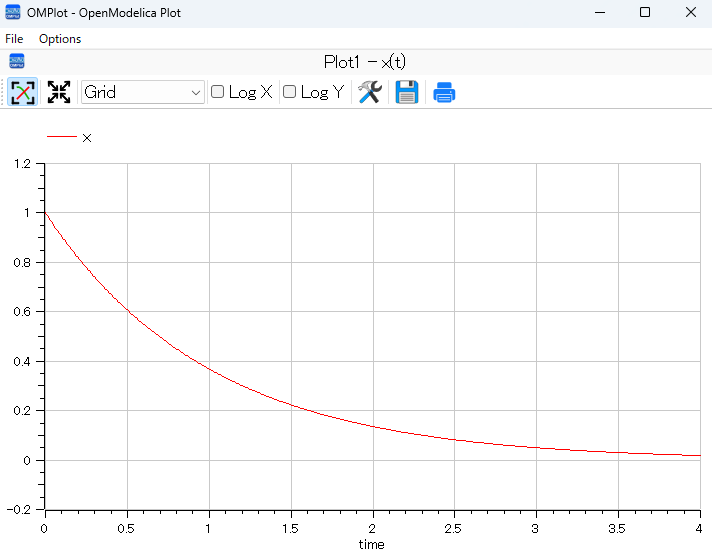
numberOfIntervals=500とすると0.08sごとに結果が出力されるため、グラフが滑らかになります。
ソルバ(dassl)はもっと細かいtimestepで計算しているため、各点の計算結果は同じとなります。
>> simulate(HelloWorld, outputFormat="csv", startTime=0, stopTime=4, numberOfIntervals=500)
record SimulationResult
    resultFile = "C:/Users/HEngi/AppData/Local/Temp/OpenModelica/HelloWorld_res.csv",
    simulationOptions = "startTime = 0.0, stopTime = 4.0, numberOfIntervals = 500, tolerance = 1e-06, method = 'dassl', fileNamePrefix = 'HelloWorld', options = '', outputFormat = 'csv', variableFilter = '.*', cflags = '', simflags = ''",
    messages = "LOG_SUCCESS       | info    | The initialization finished successfully without homotopy method.
LOG_SUCCESS       | info    | The simulation finished successfully.
",
    timeFrontend = 0.0022135,
    timeBackend = 0.0018277,
    timeSimCode = 0.0006514,
    timeTemplates = 0.0117406,
    timeCompile = 1.4681031,
    timeSimulation = 0.0660227,
    timeTotal = 1.5508294
end SimulationResult;
"[<interactive>:1:18-1:48:writable] Warning: Components are deprecated in class.
[<interactive>:1:51-1:70:writable] Warning: Components are deprecated in class.
[<interactive>:1:82-1:97:writable] Warning: Equation sections are deprecated in class.
"

>> plot(x)
true
下記のコマンドでplotの設定値を表示できます。
どんな設定ができるかを知るのにもよさそうです。
>>  list(OpenModelica.Scripting.plot,interfaceOnly=true)

"function plot
  input VariableNames vars \"The variables you want to plot\";
  input Boolean externalWindow = false \"Opens the plot in a new plot window\";
  input String fileName = \"<default>\" \"The filename containing the variables. <default> will read the last simulation result\";
  input String title = \"\" \"This text will be used as the diagram title.\";
  input String grid = \"simple\" \"Sets the grid for the plot i.e simple, detailed, none.\";
  input Boolean logX = false \"Determines whether or not the horizontal axis is logarithmically scaled.\";
  input Boolean logY = false \"Determines whether or not the vertical axis is logarithmically scaled.\";
  input String xLabel = \"time\" \"This text will be used as the horizontal label in the diagram.\";
  input String yLabel = \"\" \"This text will be used as the vertical label in the diagram.\";
  input Real xRange[2] = {0.0, 0.0} \"Determines the horizontal interval that is visible in the diagram. {0,0} will select a suitable range.\";
  input Real yRange[2] = {0.0, 0.0} \"Determines the vertical interval that is visible in the diagram. {0,0} will select a suitable range.\";
  input Real curveWidth = 1.0 \"Sets the width of the curve.\";
  input Integer curveStyle = 1 \"Sets the style of the curve. SolidLine=1, DashLine=2, DotLine=3, DashDotLine=4, DashDotDotLine=5, Sticks=6, Steps=7.\";
  input String legendPosition = \"top\" \"Sets the POSITION of the legend i.e left, right, top, bottom, none.\";
  input String footer = \"\" \"This text will be used as the diagram footer.\";
  input Boolean autoScale = true \"Use auto scale while plotting.\";
  input Boolean forceOMPlot = false \"if true launches OMPlot and doesn't call callback function even if it is defined.\";
  output Boolean success \"Returns true on success\";
end plot;"
チャプター4はここまでとなります。
なんだか既にみたような内容な気がします。


コメント